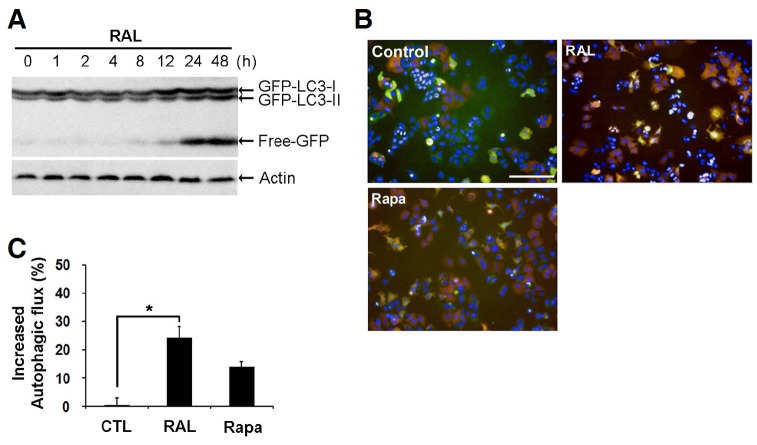
Fig. 3.
Raloxifene activates autophagic flux in MCF-7 cells. (A) MCF-7 cells were treated with 10 μM raloxifene for the indicated times. GFP was analyzed using Western blot analysis. (B) mRFP-GFP-LC3-MCF-7 cells were exposed to 10 μM raloxifene and 400 nM rapamycin (Rapa) for 24 h, and fluorescent images were obtained from the Operetta automated microscope (Magnification, 20×; Scale bar, 50 μm). The yellow puncta indicate autophagosomes and red puncta represent autolysosomes. Rapamycin was used as a positive control to visualize the autophagic flux. (C) The percent of increased autophagic flux were calculated only red puncta in the merged images. Data are representation of two independent experiments (mean ± SD). *p < 0.05 according to one-way ANOVA.

