
Figure 5.
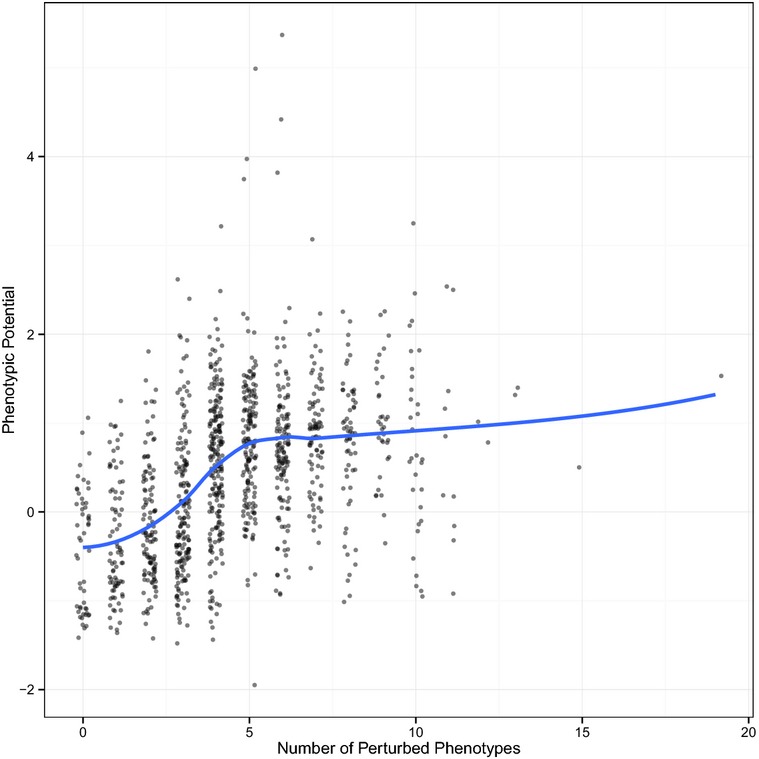
Relationship between pleiotropy and phenotypic potential
For each DAmP strain, the number of phenotypes that differ from the wild-type reference by at least one standard deviation are plotted on the x-axis. A small amount of noise was added to prevent overplotting. Phenotypic potential scores are plotted along the y-axis. The blue line indicates the result of a loess regression.