
Figure 6.
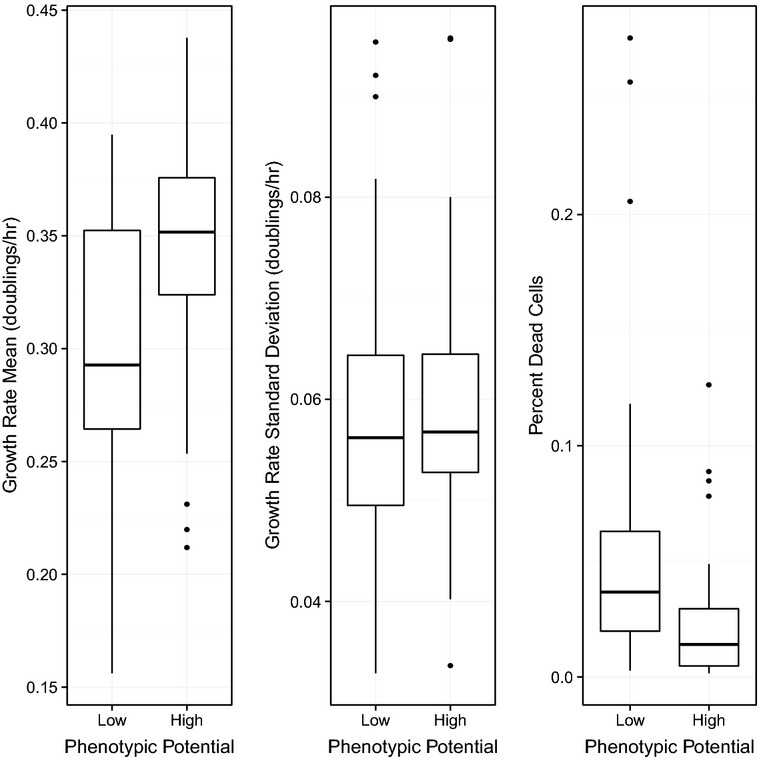
Relationship between phenotypic potential and fitness
Within each panel, the 48 DAmP strains with the lowest phenotypic potentials were grouped on the left and compared to the 48 DAmP strains with the highest phenotypic potentials, grouped on the right. Microcolony-based measurement of mean growth rate is plotted in the left panel. Standard deviation of growth rate is plotted in the middle panel. The percentage of dead cells in the population is plotted in the right panel.