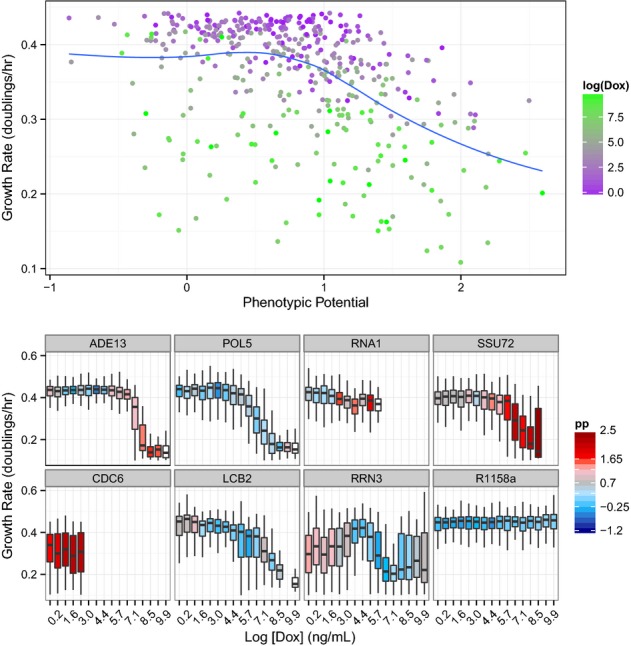
Figure 7.

Phenotypic variation and growth rates in Tet-repressible strains
In the top panel, all phenotypic potential scores are plotted against microcolony growth rates for all Tet strains across all concentrations of doxycycline. The points are shaded to indicate the concentration of doxycycline ranging from zero (purple) to 20 μg/ml (green). The lower panels show the dynamics of eight individual genes. In each case, the levels of doxycycline range from zero on the far left to 20 μg/ml on the far right. Box plots show the distributions of growth rates observed with color shading to indicate the observed phenotypic potential (blue = low variation, red = high variation, white boxes indicate too few cells to calculate a phenotypic potential, and the absence of a box indicates fewer than 10 colonies observed).
