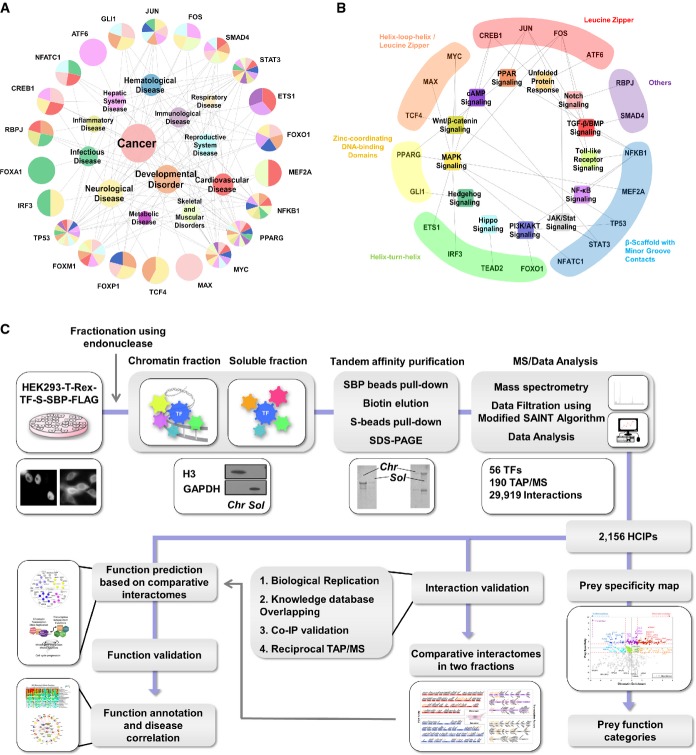
Figure 1.
- Disease correlation of 19 TFs and 4 well-studied FOX family members, based on their GO annotations. Each colour indicates one disease. The size of each coloured pie indicates the relative ratio of –log (P-value) of GO annotations in the corresponding disease.
- Pathway correlation and structural superclasses of TFs. Each coloured area indicates one superfamily.
- Schematic diagram showing the major steps involved in TAP/MS screening and data analysis of human TFs and snapshot for each part of the data. Fifty-six transcription factors, together with 70 unrelated control proteins and control vector, were constructed into a vector harbouring a C-terminal SFB-tag through gateway technology. 293T cells stably expressing each bait protein were generated by stable transfection and puromycin selection. Protein was collected and separated into two fractions by a two-step lysis process. Through the standard tandem affinity purification steps, purified protein complexes were identified by mass spectrometry analysis, and final interacting proteins were generated by SAINT algorithm-based filtration. The data were subjected to prey functional categories analysis, interaction validation and function validation. Snapshots of data generated by each step were shown aside.

