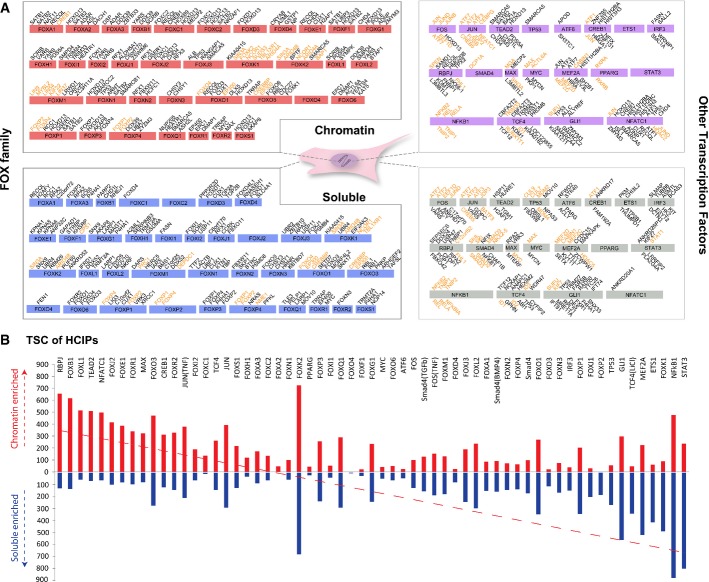
Figure 3.
- HCIPs with highest spectra counts were listed. The length of each box with the protein name on it indicates the protein size. Black fonts indicate new interactions identified by our purifications. Orange fonts indicate interactions defined by our purifications and the literature.
- Total spectra counts of TFs in different fractions. The y-axis indicates the total spectra counts (TSC) of HCIPs in corresponding TF purifications. Red bar: TSC of HCIPs in chromatin fractions; blue bar: TSC of HCIPs in soluble fractions.

