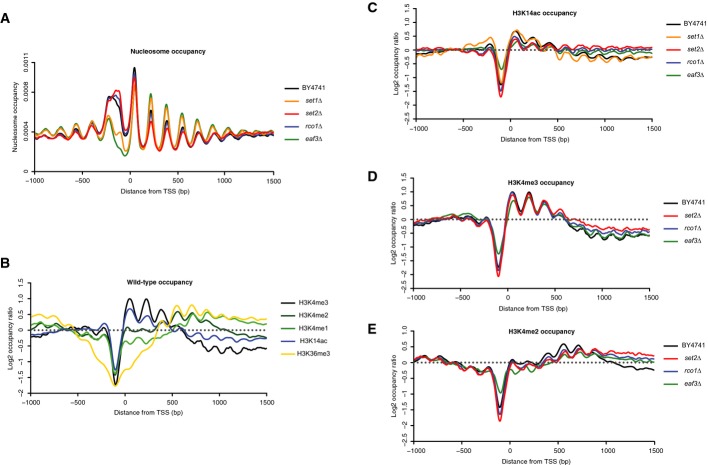
Figure 4.
- Nucleosome occupancy around annotated TSS for the wild-type and mutant yeast strains profiled in the study.
- Occupancy of the various marks profiled in the experiment in the wild-type strain BY4741.
- H3K14ac (C), H3K4me3 (D) and H3K4me2 (E) occupancies around the annotated TSS in the mutants profiled in the study.
Data information: Histone mark occupancies were normalized using the counts corresponding to chromatin inputs.

