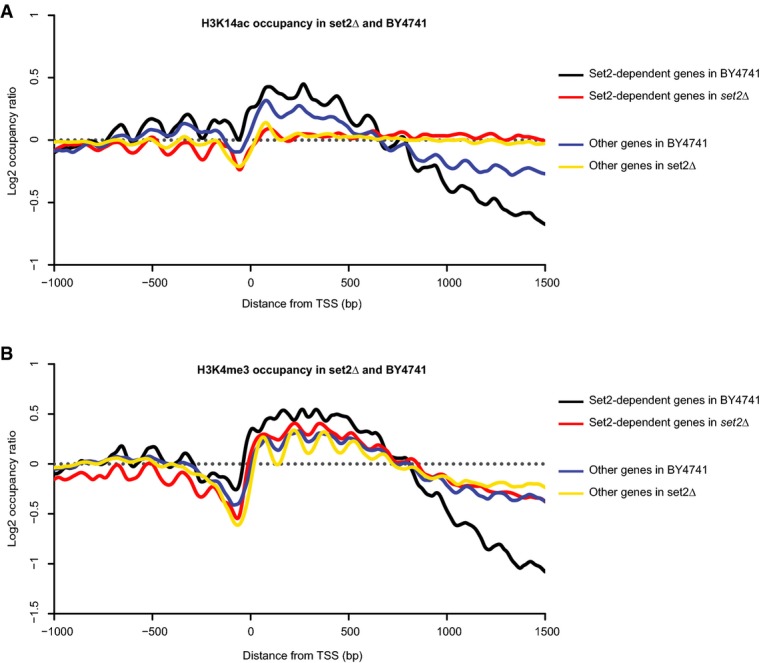
Figure 6.

Distribution of H3K14ac and H3K4me3 for Set2-dependent and -independent genes in wild-type and set2Δ strains
- H3K14ac occupancies around the annotated TSS in two groups of genes in the BY4741 and set2Δ strains. Set2-dependent genes were identified using unambiguous genome-wide mapping of internal transcription start sites.
- H3K4me3 occupancies around the annotated TSS in two groups of genes in the BY4741 and set2Δ strains.
Data information: Set2-dependent genes are either in black (for BY4741) or red (for set2Δ), while Set2-independent genes are represented as a blue line (for BY4741) or yellow line (for set2Δ).
