
Figure 2.
Phenomenological agreement between model and experiments
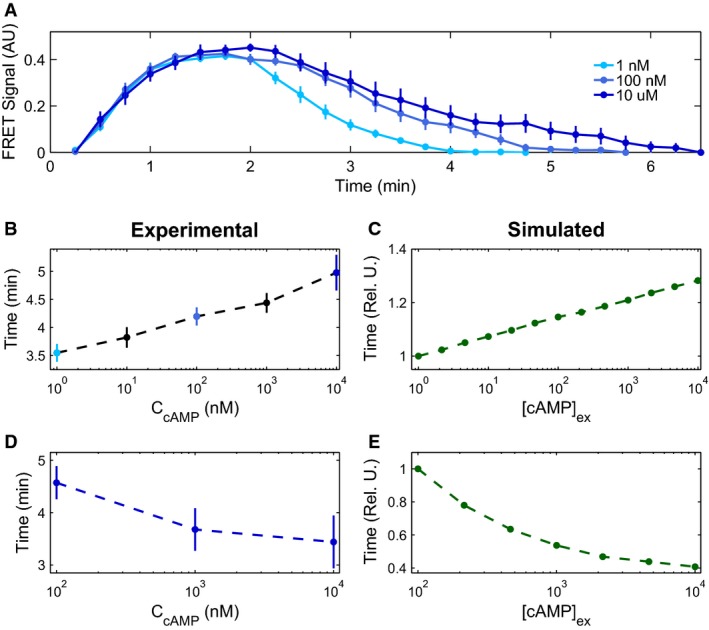
- Experimental mean accommodation spikes of cells in microfluidic devices for externally applied cAMP stimuli of 1 nM (light blue), 100 nM (medium blue), and 10 μM (dark blue) (see main text for discussion). Error bars represent SEM.
- Experimental (n = 16, 14, 14, 20, and 11 cells) (B) and modeled (C) mean initial accommodation spike widths. Error bars represent SEM. Colored data points in (B) correspond to data in (A), with additional mean accommodation spike widths taken at 10 nM and 1 μM.
- Experimental (n = 11, 16, 10 cells) (D) and modeled (E) mean oscillation times, with experimental mean oscillations found by identifying the peak Fourier transform. Error bars represent errors by bootstrapping.
Source data are available online for this figure.