
Figure 7.
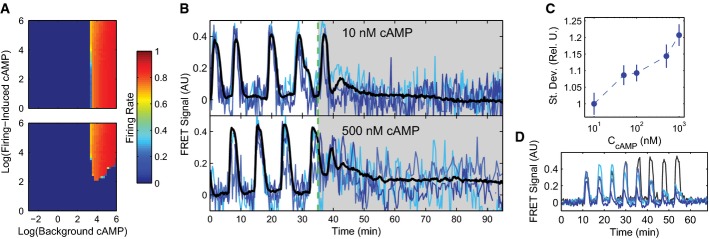
Intracellular noise in the cAMP circuit drives observed population behaviors
- Firing rate phase diagrams for single cells in a population (top) and the population as a whole (bottom) as predicted by the model with minimal noise (σ = 0.01) as a function of background and firing-induced cAMP. See Supplementary Fig S4 for other noise-source cases.
- Example single-cell (blues) and population (black) cytosolic cAMP traces taken from dual-expressing Epac1camps/mRFPmars tracer cells for oscillating populations at ˜0.4 ML density, 10 μl/min flow subjected to steps of 10 nM and 500 nM cAMP in microfluidic devices.
- Mean standard deviations of the single-cell cytosolic cAMP levels for cells in 10 experimental populations inside microfluidic devices subjected to a step stimulus of cAMP as shown in (B) from 10 to 60 min post-stimulus. Values are normalized to the mean standard deviation of cells exposed to a 10 nM external cAMP step to show the relative increase in stochastic variability; errors by bootstrapping.
- Single-cell cytosolic cAMP responses to eight 1-nM pulses, 6-min period with 1-min-long pulses (gray) and two 1-min, two 30-s, two 20-s, and two 10-s pulses (blues) given using microfluidic devices.
Source data are available online for this figure.