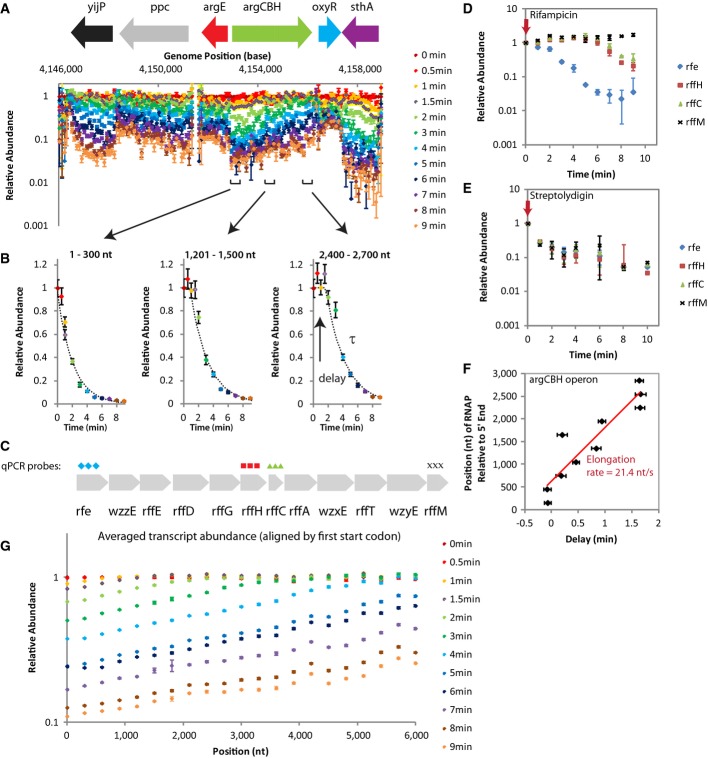
RNA abundance data over time of exponential phase MG1655 cells show trends correlating with direction of RNA synthesis. Representative normalized RNA abundance measured by RNA-seq (one experiment) for each time point is shown with corresponding genome annotation and root N error. Segments where the data exhibit a similar degradation pattern correspond with the annotated operons. The small RNA, oxyS, has been omitted from the genomic annotation due to its small size.
RNA abundance data from segments of the argCBH operon plotted against time reveal a delay in degradation. The data were fitted to extract the delay before RNA abundance decay, and the exponential lifetime, τ.
4 qPCR probes were designed against the 12-kb rfe-wzzE-rffEDGHCA-wzxE-rffT-wzyE-rrfM transcript for the experiment shown in (D) and (E), which confirms that elongating RNAPs are responsible for the delay before RNA abundance decays.
qPCR experiment in exponential phase AS19 cells treated with rifampicin, an RNAP initiation inhibitor, replicates the trend observed in RNA-seq data for exponential phase MG1655 cells treated with rifampicin. RNA in the most 5′ position, rfe, declines in abundance immediately. Mid-transcript positions (rffH and rffC) maintained steady-state levels of RNA abundance for ˜6 min before showing degradation. The most 3′ position, rffM, maintained steady-state levels of RNA for the entire duration of the experiment. Data are from two biological samples with duplicates and error bars show s.d.
qPCR experiment in exponential phase AS19 cells with streptolydigin, an RNAP elongation inhibitor, does not replicate the trend observed in RNA-seq data for exponential phase MG1655 cells treated with rifampicin. RNA abundance at all probe positions declines immediately after streptolydigin addition. Data are from two biological samples with duplicates and error bars show s.d.
The RNAP elongation rate, assumed constant and measured at 21.4 nt/s (s.e. = 0.5 nt/s), on the argCBH operon is extracted from the delay in degradation along the operon.
Averaged genome-wide view of data. All RNAs were aligned by their first start codon and averaged to obtain a genome-wide view of RNA abundance. The trends observed in (A) are reproduced on the average genome-wide scale, suggesting that they are typical.

