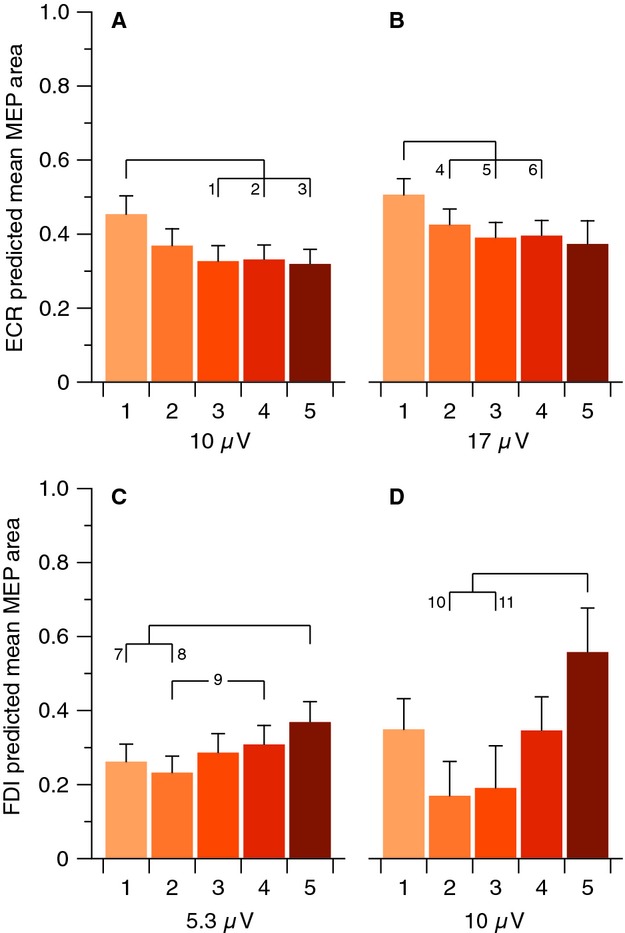
Figure 3.

Predicted mean MEP areas for different support levels at specified values of background EMG activity. (A) For ECR at 10 μV, pairwise tests showed comparisons 1 (P = 0.0013), 2 (P = 0.0011), and 3 (P = 0.0009) to be significant after correction. (B) For ECR at 17 μV, the mean value of background EMG, pairwise tests showed comparisons 4 (P = 0.0121), 5 (P = 0.0004), and 6 (P = 0.0007) to be significant after correction. (C) For FDI at 5.3 μV, the mean value of background EMG, pairwise tests showed comparisons 7 (P = 0.0006), 8 (P < 0.0001), and 9 (P = 0.0068) to be significant after correction. (D) For FDI at 10 μV, pairwise tests showed comparisons 10 (P = 0.0041) and 11 (P = 0.0194) to be significant after correction. All MEP areas are normalized relative to maximum. Error bars represent standard error of the mean.
