Figure 1.

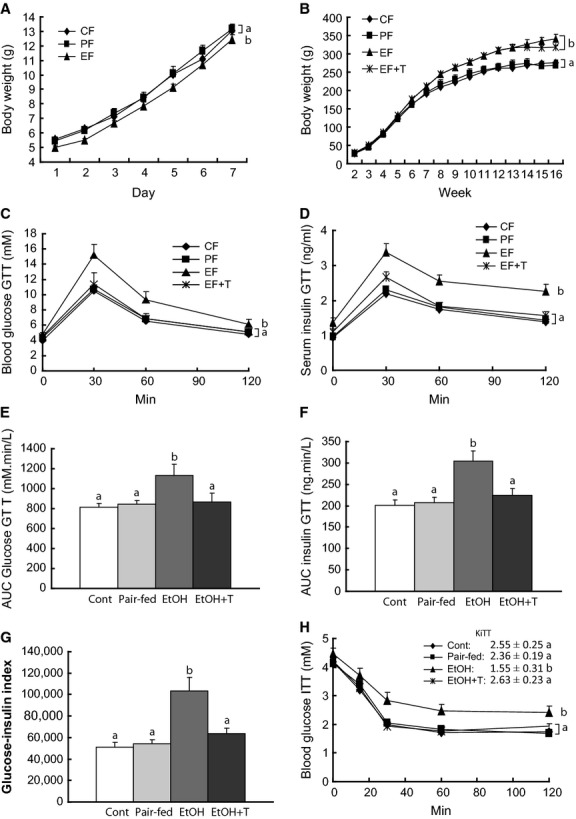
Effect of maternal ethanol on body weight, glucose tolerance, and insulin sensitivity in adult female rat offspring. Body weight during the first week (A) and from 2nd to 16th week (B) of age in offspring of dams exposed to ethanol (EF) versus control (CF) and pair‐fed (PF) dams. EF + T are EF offspring treated with tauroursodeoxycholic acid sodium. Blood glucose (C), insulin (D), area under the curve (AUC) for glucose (E), AUC insulin (F), and glucose‐insulin index (H) during glucose tolerance test (GTT). Blood glucose (G) during insulin tolerance test (ITT). KITT shown in the insert. Curves or means with different letters are significantly different (Tukey's test, P < 0.05).
