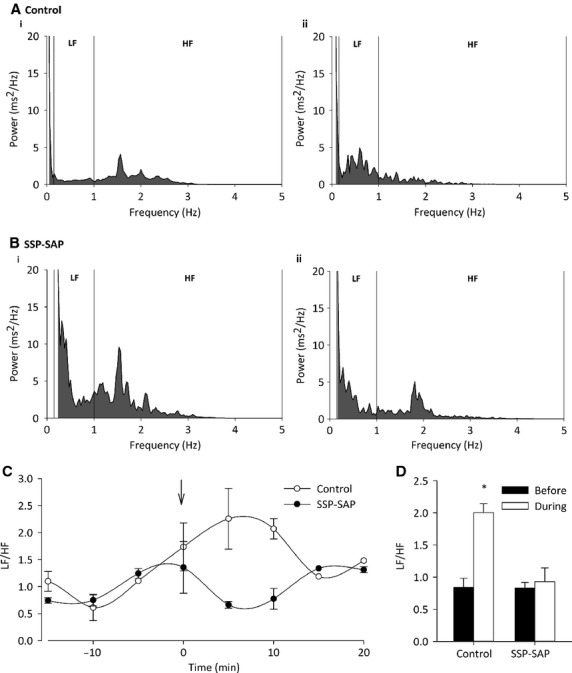
Figure 4.

LF/HF response to stress in SAP‐SSP‐lesioned rats. (A) Representative fast Fourier transform for control rats (i) before and (ii) after mild handling stress. (B) Representative fast Fourier transform for SSP‐SAP rats (i) before and (ii) after mild handling stress. In control animals, an increase in LF and decrease in HF power are seen as a result of stress. Both LF and HF are reduced in lesioned rats after stress. (C) Average LF/HF ratio per 5 min in both groups of rats. Arrow indicates time of mild handling stress. (D) LF/HF ratio significantly increases in control animals subjected to stress from 0.84 ± 0.14 to 2.02 ± 0.15 (n = 3 per group; P < 0.05 by one‐way ANOVA). This response was abolished in SSP‐SAP‐lesioned rats (n = 3 per group; P > 0.05 by one‐way ANOVA).
