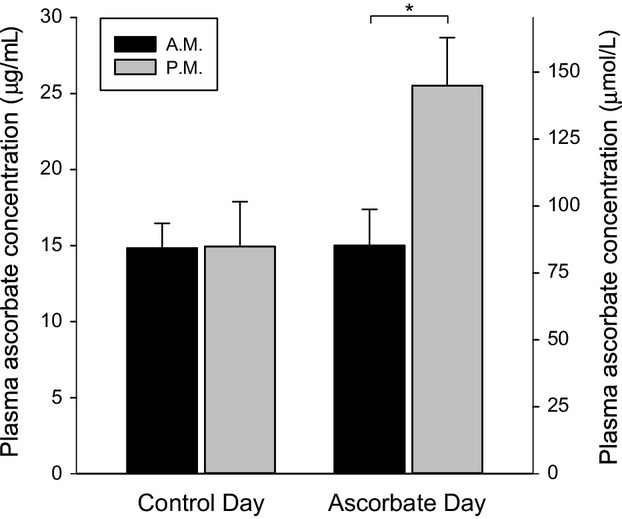
Figure 1.

Plasma ascorbate concentration before and after infusion of saline control or ascorbate. Venous blood samples were taken at the beginning (denoted A.M.) and end (denoted P.M.) of the protocol on each day. *indicates a statistically significant difference (P < 0.001). Data are mean ± SD.
