Figure 1.

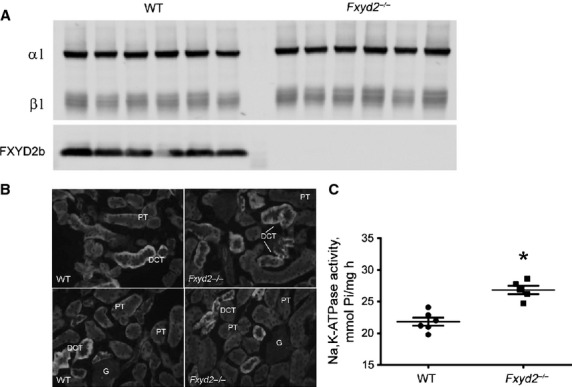
Na, K‐ATPase in renal cortex from WT and Fxyd2−/− mice. (A). Representative Western blot shows staining with K3 antibody to detect Na,K‐ATPase α1 and β1 subunits in cortical membranes. Equal amounts of protein (5 μg) were loaded per lane, n = 6 for each genotype. Staining with antibody against FXYD2b (RNGB) was used to verify mouse genotype. (B) Immunofluorescence staining forβ β1 subunit of Na,K‐ATPase. PT, proximal convoluted tubules, DCT, distal convoluted tubules, G, glomerulus. Intensity of stain was higher in DCT than in PT, and similar for both genotypes. (C) Na,K‐ATPase activity was assayed from membranes of WT (closed circles) and Fxyd2−/− mice (closed squares) (n = 6 for each genotype). Ouabain‐dependent ATP hydrolysis (Vmax, μmol Pi/mg h) is expressed as means ± SEM. The asterisk indicates statistical significance (P < 0.05).
