
Figure 2.
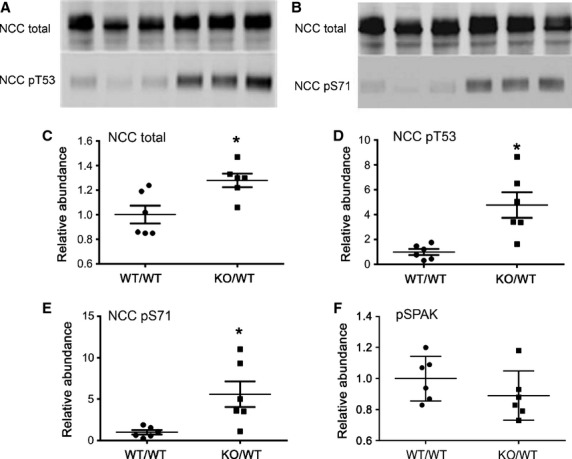
Enhanced abundance and basal NCC phosphorylation in Fxyd2−/− mice. Representative immunoblots of NCC total, NCCpT53 and NCC pS71 in renal cortex of WT and Fxyd2−/− mice (A and B). Equal amounts of protein were loaded per lane. Blots were scanned, and the density values were normalized to mean density of the WT group for NCC total (C), NCC pT53 (D), NCC pS71 (E), and pSPAK (F).The data are expressed as means ± SEM. Asterisks indicate statistical significance (P < 0.01).