Figure 3.

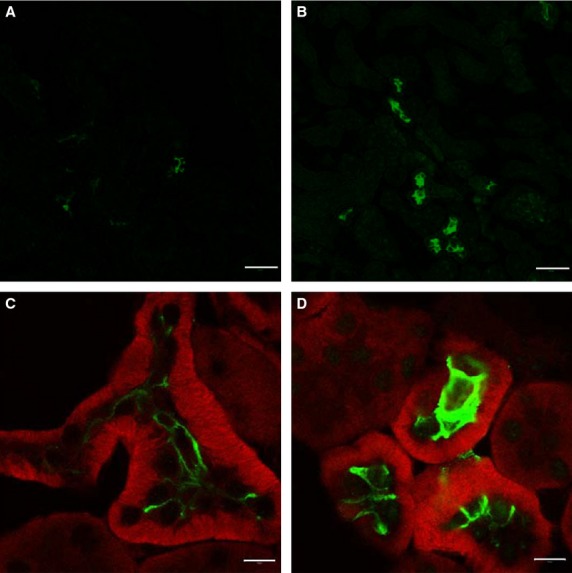
Immunofluorescence localization of phosphorylated forms of NCC in kidneys from WT and Fxyd2−/− mice. (A and B). Staining with anti‐NCC pS71 antibody on sections from WT (A) and Fxyd2−/− (B) mice. While almost no signal was detected in WT (A), a significant increase in phosphorylation at Ser71 was seen in apical DCT membranes in kidney from knockout mice (B). Bar, 50 μm. (C and D). Dual immunofluorescent staining for β1 subunit of Na,K‐ATPase (red) and anti‐NCC pS71 (green) is shown at high magnification. No significant difference was noticed in the expression level of Na,K‐ATPase β1 subunit in DCT between WT and Fxyd2−/− mice, while great enhancement was seen in the phosphorylation level of NCC at Ser71 in the knockout mice (D) compared to WT (C). Bar, 10 μm.
