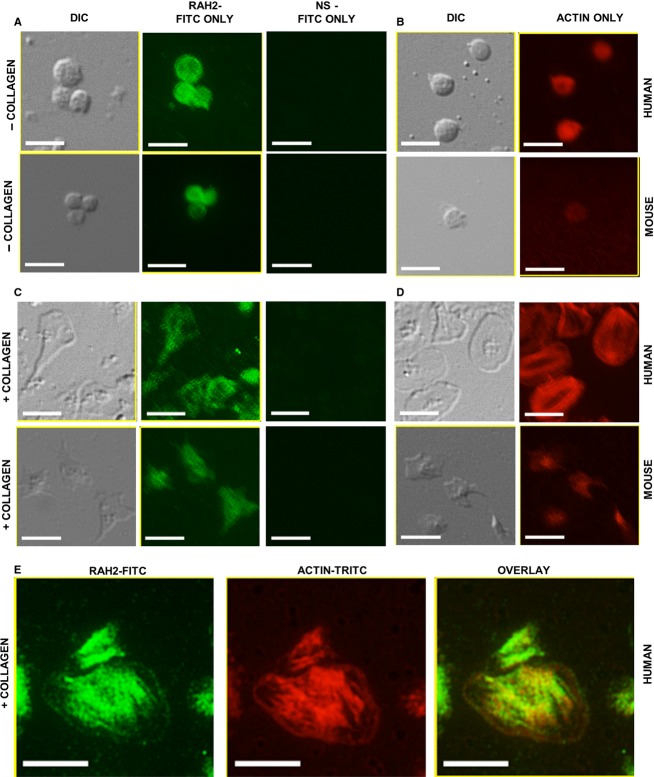
Figure 2.
Distribution of h2‐calponin in human and mouse resting versus activated platelets. Resting platelets showing (A) RAH2 immunofluorescence and (B) actin staining. Platelets activated on a collagen substrate showing (C) RAH2 immunofluorescence and (D) actin staining. (E) Colocalization of h2‐calponin and actin in activated human platelets. Green = h2‐calponin, Red = actin, yellow = colocalization. Images were cropped from their corresponding originals and enlarged to display structures of interest. Size bar indicates 5 μm.

