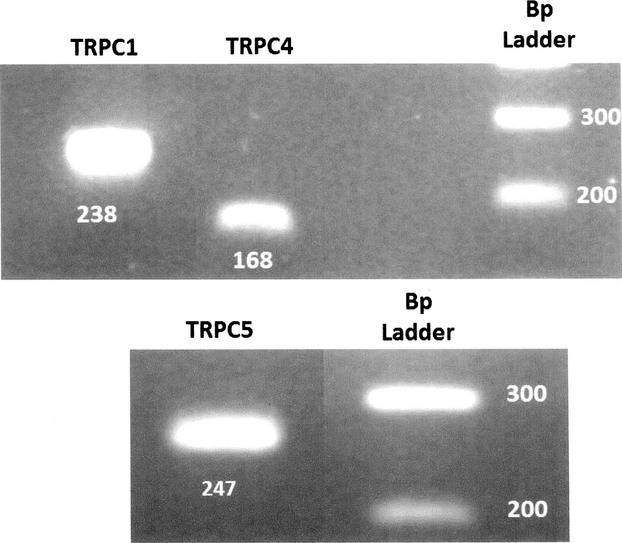
Figure 4.

Two different gels; one for TRPC1 and TRPC4 (top) and another for TRPC5 (bottom) isoforms, run under the same conditions. RT‐PCR for TRPC 1, 4, and 5 identifying three bands at a 238, 168, and 247 bp. On the top columns 1 and 2 total mRNA obtained from isolated juxtaglomerular (JG) cells. Column 3 is the “no‐template” negative control. Column 4 is the calibration scale (100 bp ladder). On the bottom column 1 is total mRNA obtained from isolated JG cells. Column 2 is the “no‐template” negative control and column 3 is the calibration scale (100 bp ladder).
