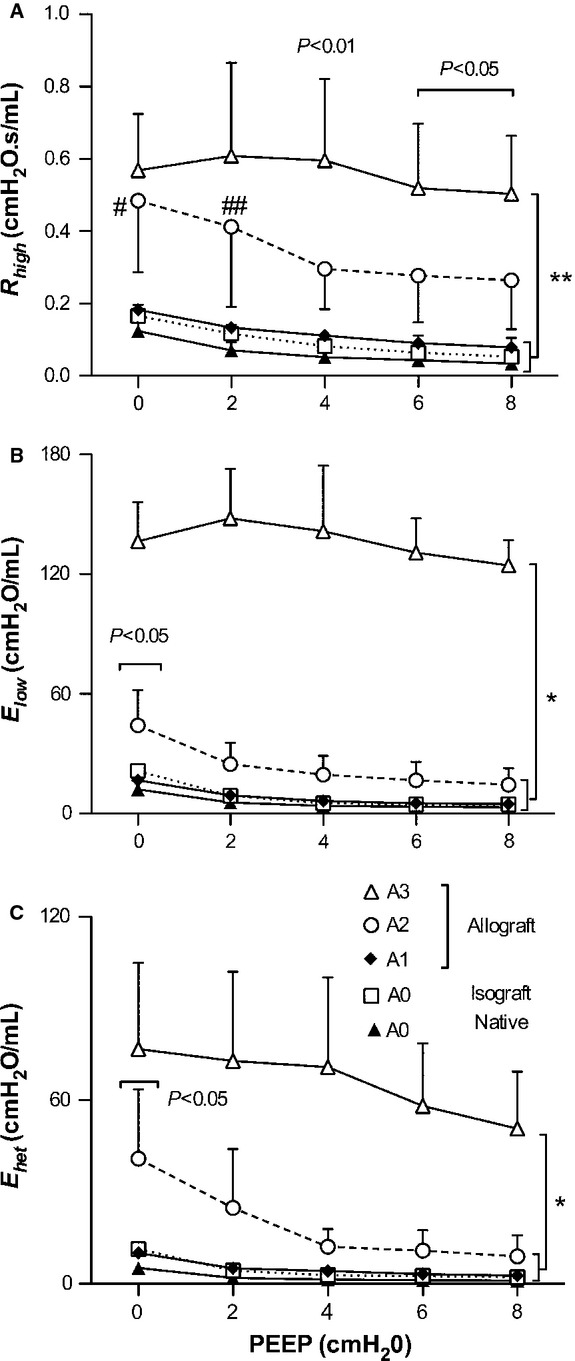
Figure 3.

Mean ± SD of Rhigh, Elow, and Ehet as function of PEEP levels. (A) Rhigh in A3 was increased than both A1 and A0 at all PEEP level (**P < 0.001), and also higher than A2 above PEEP 4 cmH2O (P < 0.01 and P < 0.05, respectively). Significance denoted by # and ##; between A2 and A1 (P < 0.01 and P < 0.05, respectively). (B) Elow of A3 was increased than the other group in all PEEP level (*P < 0.001), and A2 was only increased than A1 and A0 at PEEP 0 cmH2O (P < 0.05). (C) All group of Ehet were decreased according to PEEP levels. A3 was increased than the other group in all PEEP level (*P < 0.001), and A2 was increased than A1 and A0 at PEEP 0 cmH2O (P < 0.05).
