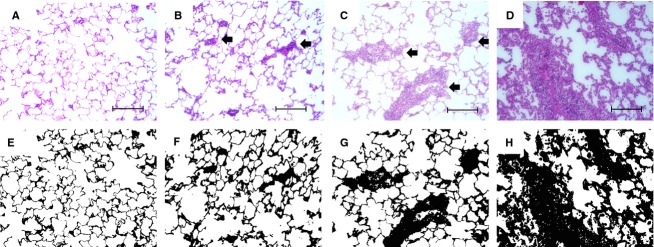
Figure 4.

Examples of hematoxylin and eosin‐stained sections of lungs after transplantation. (A) A0 normal lung, (B) A1 lung showed a sparse perivascular mononuclear infiltrates, (C) A2 lung had more frequent and wide perivascular infiltrates, which were readily recognized at low magnification. (D) A3 showed extensive infiltration not only in perivascular and peribronchiolar, but also into interstitial and alveolar airspace. (E–H): binary images that were converted from (A–D). Tissue fraction ratio (TF) was calculated from the ratio of tissue and cell infiltration areas (black) to the total area (black + white). Original magnification was ×20. Bar represents 100 μm. Arrows showed perivascular mononuclear infiltrate lesions.
