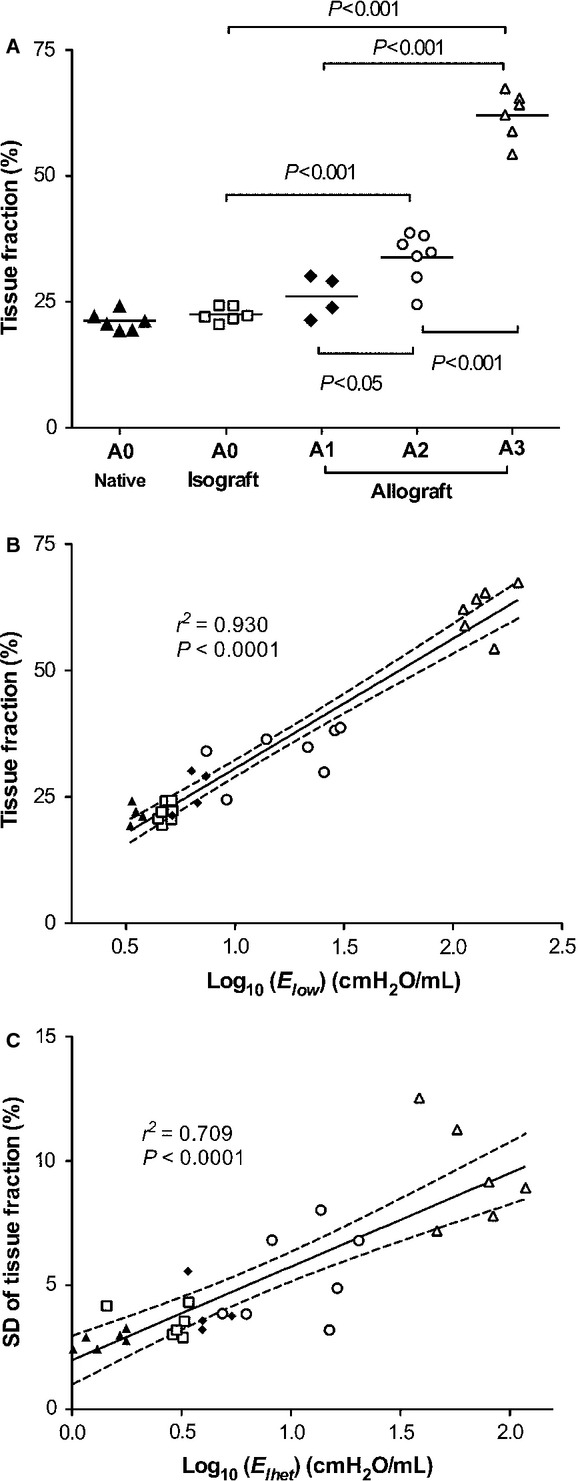
Figure 5.

(A) Mean value of TF (%) with individual animals. Horizontal bar indicates mean value of each group. (B) Relationship between TF (%) and Elow (log scale) showed the strong correlation (r2 = 0.930, P < 0.0001), and (C) SD of TF (%) and Ehet (log scale) indicated the significant correlation (r2 = 0.709, P < 0.0001). Black line showed the linear regression, and dot lines were 95% confidence intervals.
