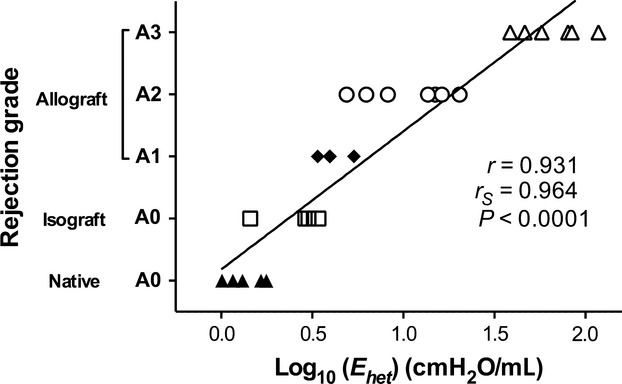
Figure 6.

Plots of A‐grade and Ehet (log scale) at PEEP 4 cmH2O in individual animals. Pearson correlation coefficient (r) was 0.931, and Spearman's rank correlation coefficient testing (rs) was 0.964 (P < 0.0001, respectively). Black line showed the regression of Pearson correlation.
