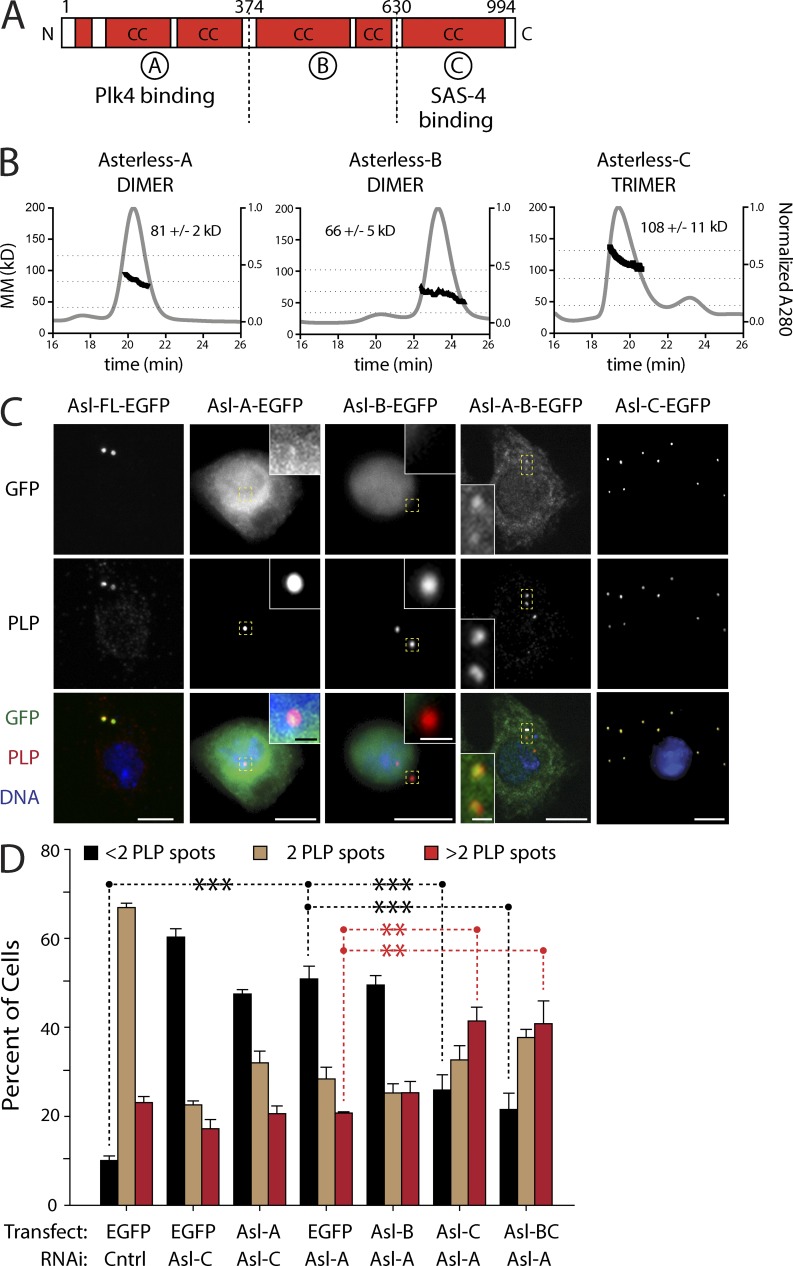
Figure 1.
The Asl-C region is sufficient for centriole duplication, whereas the Asl-A region is not. (A) Linear map of the Drosophila Asl polypeptide showing functional and structural domains. Red boxes indicate regions of predicted coiled coils (CC). Asl is divided into three previously identified scaffolding domains (A, B, and C). Asl-A binds Plk4 and Asl-C binds SAS-4. (B) Asl fragments oligomerize. Three consecutive His6-tagged Asl fragments: Asl-A (aa 1–357), Asl-B (aa 358–625), and Asl-C (aa 626–994) were analyzed using SEC-MALS. Normalized A280 is shown in gray (y axis at right), and elution time is indicated in minutes (x axis). Calculated MM was determined for each elution peak and is represented by the dark trace (y axis at left, n = 3 experiments). Mean molecular masses (±SD) for the traces are indicated. Horizontal dashed lines indicate the molecular masses of hypothetical monomeric, dimeric, and trimeric species for each fragment. (C) Asl-C contains the centriole-targeting domain. S2 cells were depleted of endogenous Asl for 3 d using RNAi targeting the 5′–3′UTR and transfected with the indicated inducible Asl-EGFP construct. While under continuous RNAi treatment, transfected cells were allowed to recover for 24 h, induced to express for an additional 24 h, and then immunostained for centrioles using the anti-PLP antibody. Representative images of localization patterns of the Asl fragments are shown (n = 100 cells scored/construct). Insets show centrioles (yellow boxes) at higher magnification. Bars: (main images) 5 µm; (insets) 0.5 µm. (D) Replacement of endogenous Asl with Asl-BC or Asl-C rescues centriole duplication and promotes centriole amplification. S2 cells were depleted of endogenous Asl using the indicated exon-targeting RNAi for 3 d and transfected with the indicated inducible Asl-EGFP construct (or control EGFP). While under continuous RNAi treatment, transfected cells were allowed to recover for 24 h and induced to express for an additional 3 d, and centrioles were visualized by anti-PLP immunostaining. Each bar shows the mean percentage of cells containing the indicated number of centrioles (n = 3 experiments; 300 cells counted per treatment, per experiment). Asterisks mark significant differences (relative to control) for selected comparisons. **, 0.01 > P ≥ 0.001; ***, P < 0.001. Error bars indicate SEM. Cell lysates were immunoblotted to verify expression of the Asl-EGFP fragments and knockdown of endogenous Asl (Fig. S1 D). Cntrl, control.

