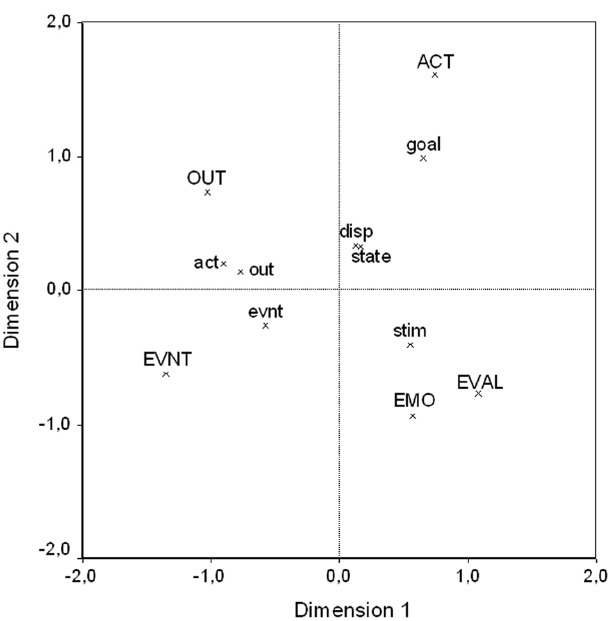
FIGURE 3.

Asymmetric correspondence analysis plot of free-response explanations, Experiment 1. Behavior types are in standard coordinates, explanation types in principal coordinates. Percentage of inertia: Dimension 1 = 50.43%, Dimension 2 = 26.65%. Behavior Types are depicted in upper case letters, explanation types in lower case letters. ACT, act: action; EVAL: state-evaluation; EMO: state-emotion; OUT, out: outcome; EVNT, evnt: event; goal: goal; state: temporary state; disp: disposition; stim: stimulus attribute.
