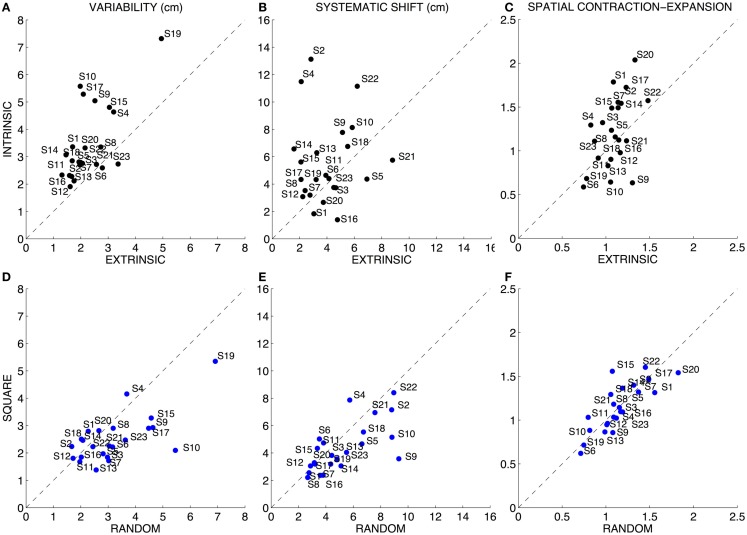
Figure 3.
Quantitative assessment of the position sense. Left column (A,D): variability (both axes are in centimeters). Central column (B,E): systematic shift (both axes are in centimeters). Right column (C,F): spatial contraction–expansion (both axes are normalized, adimensional). Top row: comparison between the Intrinsic and Extrinsic-matching modality. Bottom row: comparison between the two sequences of target presentation (random vs. sequence of squares). In all the graphs, the dotted line indicates equal performance in the two compared conditions Brookhart et al. (1984).

