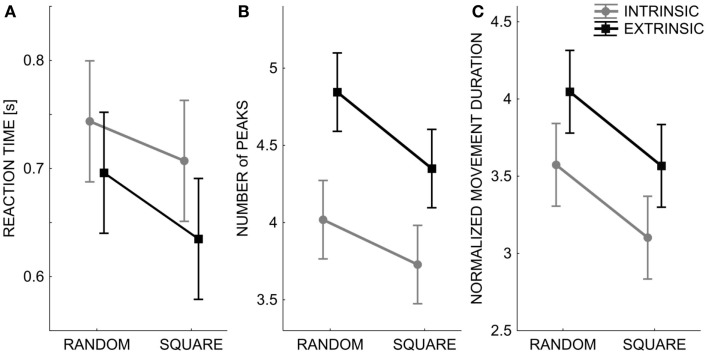
Figure 5.
Spatial and temporal pattern (mean ± SE over all subjects) of the subjects’ movement trajectories: Reaction time (A), smoothness – number of peaks in the speed profile (B), normalized movement duration (C). The two lines correspond to the performance in the two different test conditions: Intrinsic-matching test (gray lines) and Extrinsic-matching test (black lines). X axis: the two different orders of targets’ presentation: random or sequence of squares.

