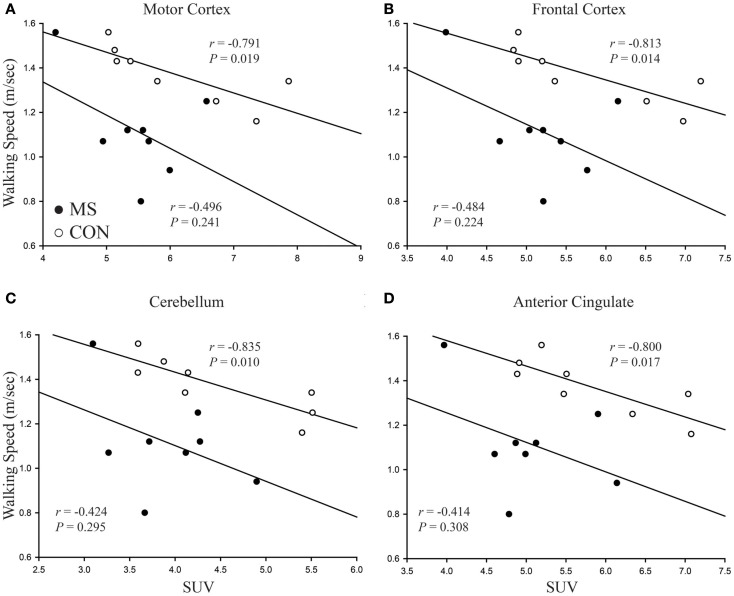
Figure 4.
Visual representation of correlations between walking speed and brain region FDG uptake. In each case, the strength of the correlation is less in patients with MS compared to controls. As well as correlations being weaker, patients with MS show no statistical significance while correlations for the control group all reach statistical significance. (A) Motor cortex, (B) frontal cortex, (C) cerebellum, (D) anterior cingulate.

