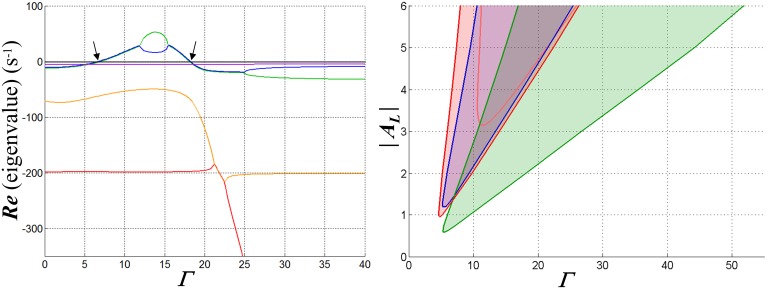
Figure 5.
Graphs illustrating the fixed-point stability characteristics of one configuration of the WTA network when a single input is active. Inhibitory synaptic conductance is inward-rectifying with reversal potential −70 mV. The resting membrane time constant τR in the competitive neuron is set to 20 ms; membrane charging in the inhibitory interneuron is modeled with a pole with time constant 5 ms, and is cascaded with a four-state model for GABAB receptor dynamics (Destexhe et al., 1995) that introduces three additional poles in the feedback path. At left are depicted the real parts of the poles of the closed-loop system at its fixed points as functions of the input strength Γ, in this case for AL = −4. Each is coded by a different color. Where two curves overlie, the corresponding poles are complex conjugates. The arrows indicate the points at which a complex pole-pair transitions between left- and right-half-planes and bracket an input range over which the fixed points are unstable. In the middle part of this region, the poles are real and distinct, implying exponential divergence of trajectories away from the fixed point—but large-signal limit cycles (i.e., oscillations) are ultimately assumed by such trajectories. At right, the region over which the network is unstable in the space spanned by Γ and AL is shown in red (for purposes of comparison, the pink curve shows the boundary of this region when GABAA kinetics are substituted for GABAB). In the blue area the membrane conductance in the competitive neuron is negative for the input and inhibitory states at the fixed point, and in the green, WTA bistability would be possible if the input to a second neuron were active (and feedback instantaneous).

