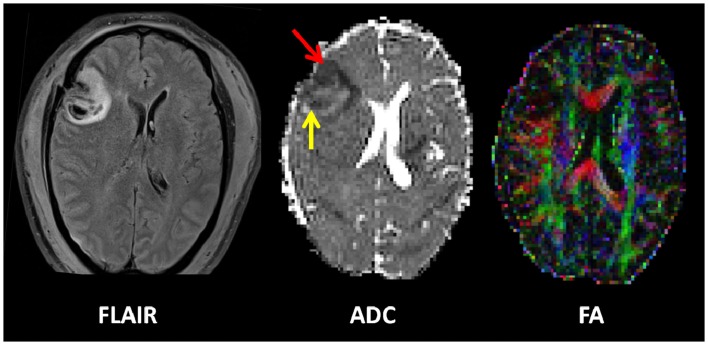
Figure 2.
Example of an early contusion in a 49-year-old male who sustained a severe TBI after an alleged assault. He was GCS 4 at the scene. Imaging was performed approximately 48 h after injury. A left frontal contusion can be clearly seen on the FLAIR image. The apparent diffusion coefficient map (ADC) shows a cytotoxic rim (red arrow) and vasogenic rim (yellow arrow). The combined fractional anisotropy and directional map (FA) shows loss of fibers integrity at the site of the contusion. Color hue indicates direction as follows; red, left–right; green, anteroposterior; blue, superior–inferior.

