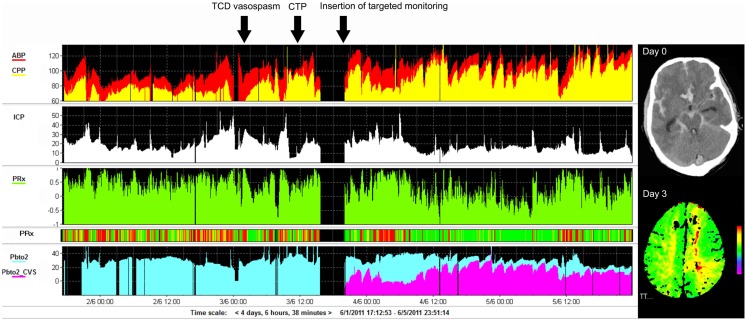
Figure 5.
Example of monitoring and imaging data from a patient with SAH (WFNS 5) with an AComA aneurysm, which was clipped on day 2 post-ictus. Invasive monitoring probes including ICP and PbtO2, as well as an EVD, were inserted on the right side on admission. During the course of treatment, the patient developed cerebral vasospasm, which was initially detected using TCD monitoring on day 3 post-ictus (black arrow). Subsequent CTP on day 4 demonstrated a perfusion deficit in the left ACA territory (second black arrow signifies the time CTP performed), i.e., contralateral to the PbtO2 probe (importantly, the PbtO2 values were within normal range at all times, i.e., >25 mmHg and further responded to hypertension, rising to >30–35 mmHg). A further PbtO2 probe, targeted to the area of perfusion deficit seen on CTP, was inserted (third black arrow indicates time of insertion), which demonstrated lower/ischemic (<15 mmHg) values of PbtO2 (purple color on graph). ACA, anterior cerebral artery; AComA, anterior communicating artery; CTP, CT perfusion; EVD, external ventricular drain; PbtO2, brain tissue oxygen; SAH, subarachnoid hemorrhage; TCD, transcranial Doppler; WFNS, world federation of neurosurgical societies scale.

