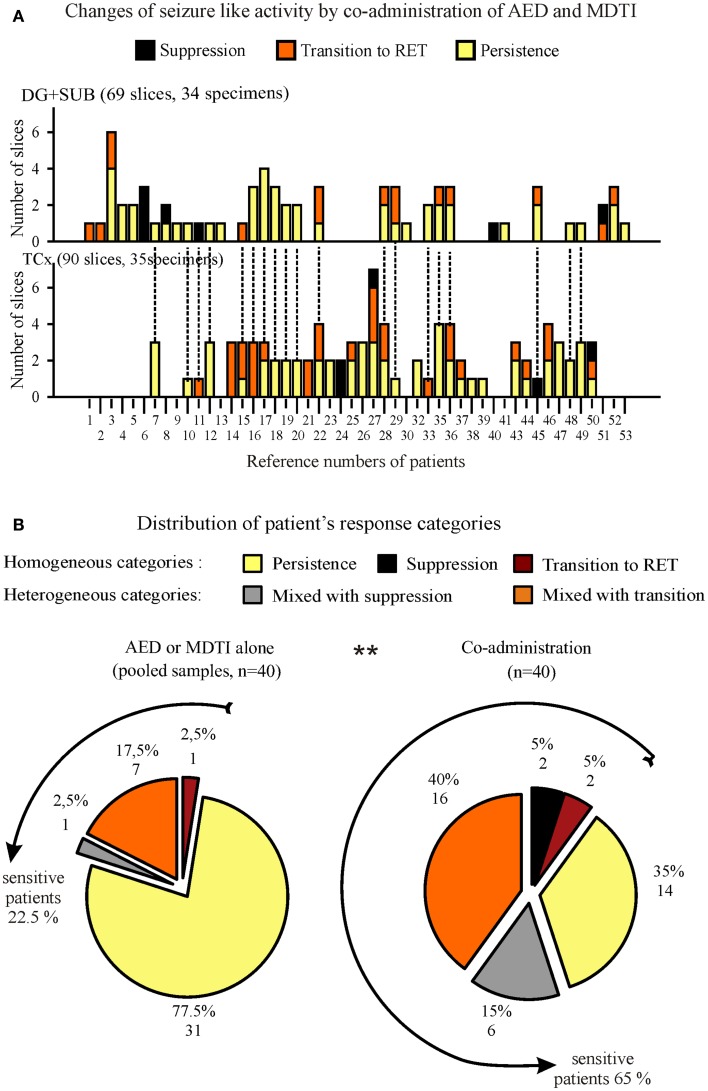
Figure 10.
Summarized responses to co-administration of AED and MDTIs in specimens and patients. (A) Effects in slices from hippocampal (top) and cortical (bottom) specimens, ordered by patient number for determination of the patient’s response category. Patients providing both, hippocampal and cortical specimens are marked by dotted lines on top of columns in (B). (B) Proportional distribution of different response categories for patients with at least two slices in the analysis. In order to evaluate the changes by co-administration, we present two circles, one for responses to AED or MDTIs alone (pooled sample, left) and another one for responses to co-administration (right). The lines around circles indicate subgroups of patients who were “sensitive” to the respective treatment in at least one slice. Numbers in parenthesis denote the number of slices/specimens (A) or the number of patients (B).

