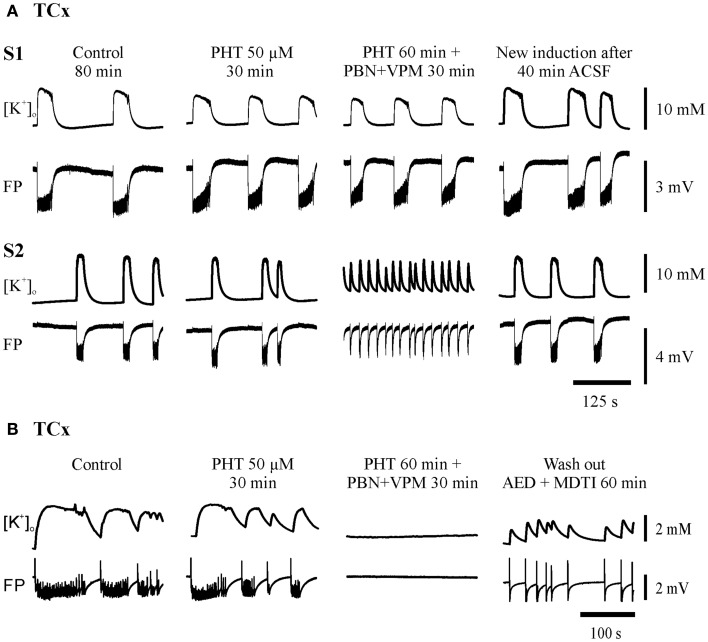
Figure 5.
Typical experiments in slices from TCx-specimens. The traces were taken at the end of all subsequent protocol sequences (control, AED, AED + MDTIs, washout). (A) In sister-slices from the same specimen: S1 displaying resistance of SLEs against PHT and PHT + PBN + VPM; S2 illustrates resistance against PHT but transition of SLE to RET during co-administration (PHT + PBN + VPM); (B) in another specimen also displaying resistance of SLE against PHT but suppression of SLE during co-administration (PHT + PBN + VPM). The drugs applied are described above each pair of traces, which display [K+]o (top) and field potential (FP) (bottom). Calibration bars for amplitude and time are given on the right.

