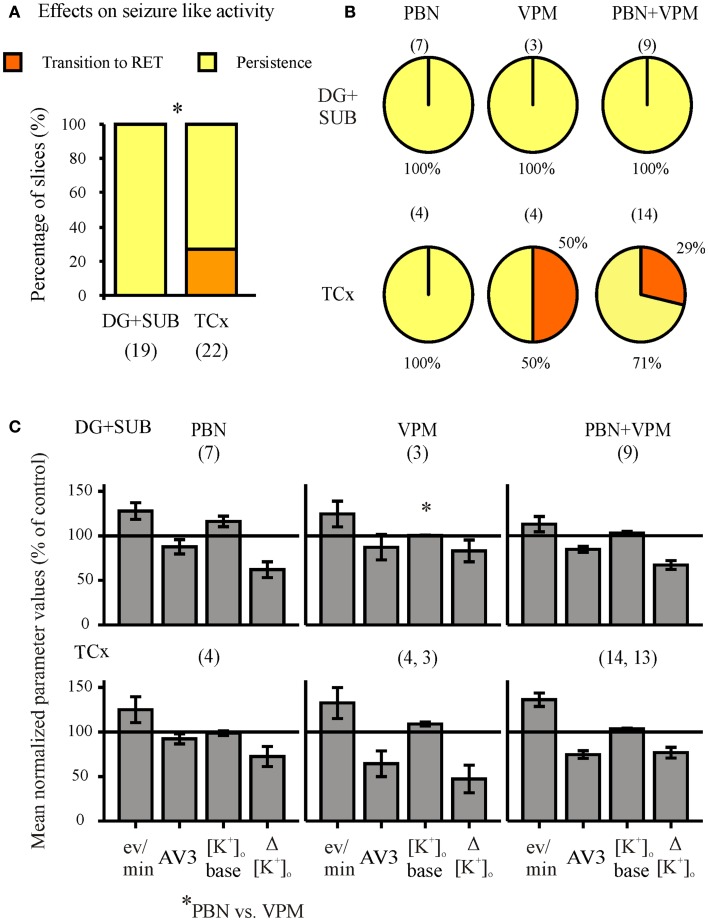
Figure 8.
Summarized effects of unspecific inhibitors of P-glycoprotein (Pgp) and multi-drug resistance-associated proteins (MRPs). Categories of drug effects, marked by different colors, are shown on top of (A). (A) Proportional distribution of effects after administration of MDTIs in hippocampal and cortical slice-groups. (B) Circles representing the distribution of effects by probenecid (PBN), verapamil (VPM), and both PBN and VPM in hippocampal (top) and cortical slice-groups (bottom). (C) Corresponding averaged remaining normalized parameter values for event rate, AV3 (average of normalized values for sfp, peak, and duration), [K+]o base, and ([K+]o. Ordinates: (A) percentage of slices; (C) means ± SEM for percentages of control values. Signs for significant differences between proportional distributions *p ≤ 0.05, or ranges of values for PBN vs. PBN + VPM *p ≤ 0.05. Numbers in parenthesis give number of slices in sub-samples (A,B). The numbers in (B) also apply to (C).

