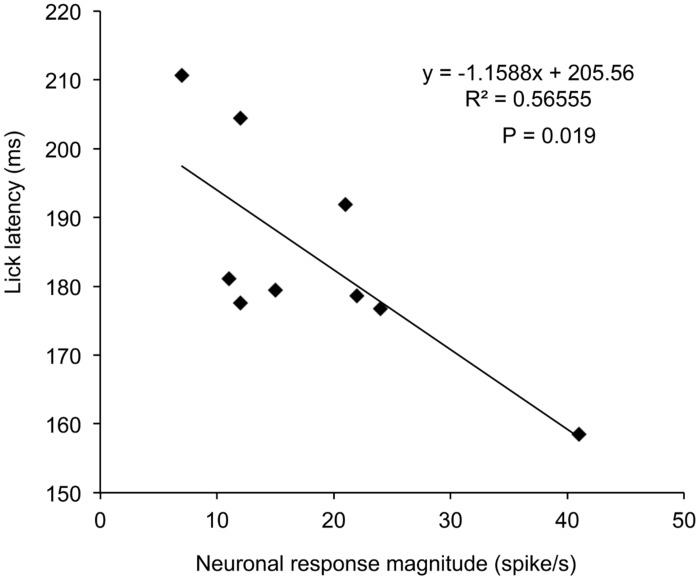
FIGURE 5.
Relationships between response magnitudes to the CSs and lick latencies in session 3 in the disengagement-related neuron shown in Figure 3. There was a significant negative correlation between the response magnitudes and lick latencies (P = 0.019, simple linear regression).

