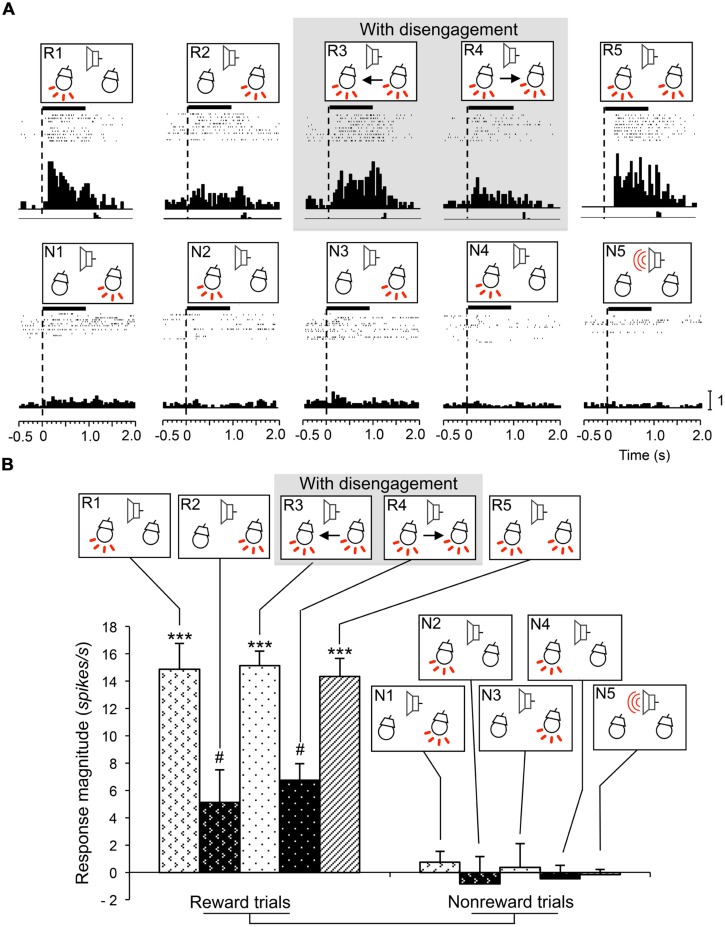
FIGURE 6.
An example of a reward and attention shift-related neuron recorded from the right SC. (A) Raster displays of neuronal activity and summed histograms in response to each stimulus. The neuron responded to the infrequent CSs in the reward trials, but not to the frequent CSs in the non-reward trials. (B) Comparison of response magnitudes of the neuron shown in A to the CSs. ***significantly different from the CSs the CSs in N1 to N5 (Tukey test, P < 0.001); # significantly different from the CSs in R1, R3, and R5 (Tukey test, P < 0.05). Other descriptions are the same as for Figure 3.

