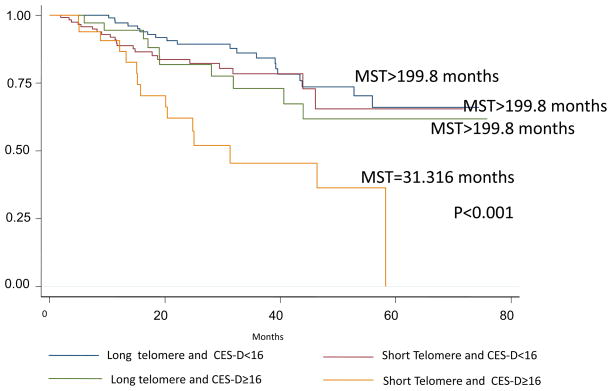
Figure 3.
Kaplan-Meier survival curves by cross-classification of CES-D (≥16 vs. <16) and telomere length (long vs. short). Telomere length was categorized (long vs. short) by median split. Differences between curves were tested by Log-Rank test with P value shown. Note: MST=median survival time; CES-D= Center for Epidemiologic Studies Depression Scale.

