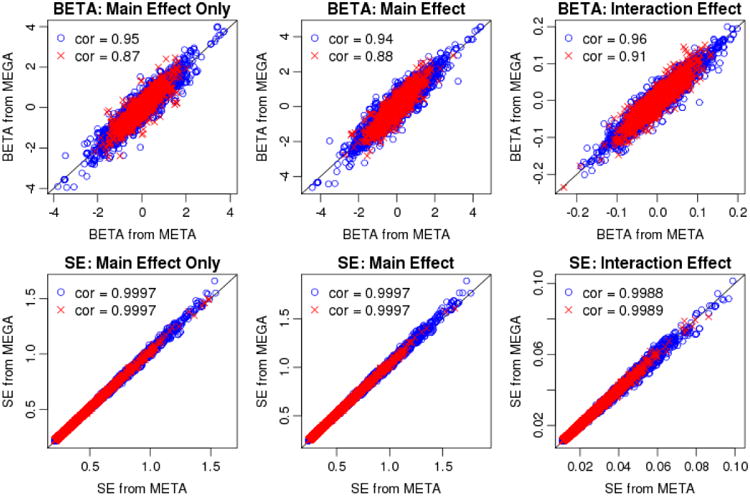
Figure I.

Scatterplots showing effect sizes (1st row) and standard errors (2nd row) from mega-analysis versus meta-analysis. The main effect only BETA (1st column) corresponds to δg in equation (1). The main effect BETA (2nd column) and interaction effect BETA (3rd column) correspond to βg and βge in equation (2), respectively. Red crosses are SNPs with heterogeneous effect sizes across studies (i.e., p-value of Cochran's Q-test < 0.05), and blue circles are SNPs with p-value of Cochran's Q-test ≥ 0.05. The correlations between the two methods across all SNPs were identical to the correlations across blue circles (up to two decimal places). The black diagonal line indicates where the values on the two axes are equal.
