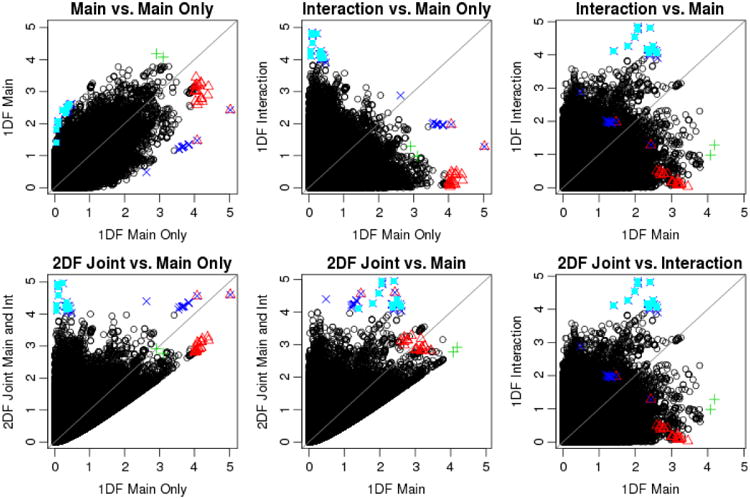
Figure IV.

Scatterplots of -log(p) values across the 4 analysis options using genomic controlled mega-analysis. Red points are 24 SNPs with p-value < 1×10⁻⁴ from the main effect only test. Green points are 2 SNPs with p-value < 1×10⁻⁴ from the main effect test. Blue points are 18 SNPs with p-value < 1×10⁻⁴ from the 1 df test of interaction effect (in the presence of main effect). Cyan points are additional 17 SNPs with p-value < 1×10⁻⁴ from the 2 df test of joint main and interaction effects.
