
Figure 1.
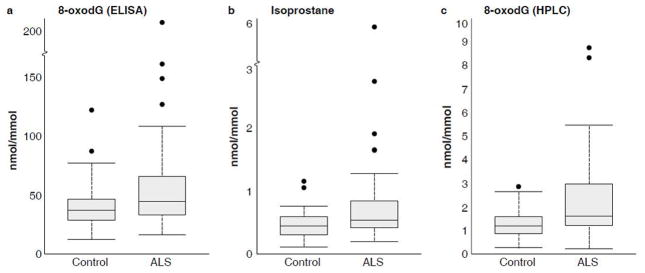
Data distributions for urinary oxidative stress markers (adjusted for creatinine): a) 8-oxodG measured by ELISA, b) isoprostane measured by ELISA, and c) 8-oxodG measured by HPLC/ECD. For each boxplot, the middle dark line represents the median. The shaded box represents the middle two quartiles (Q2 and Q3) of the data. The brackets at the end of the dashed lines represent the data point closest to and within 150% of the Q2/Q3 data span. The dots represent outlier values.