
Figure 4.
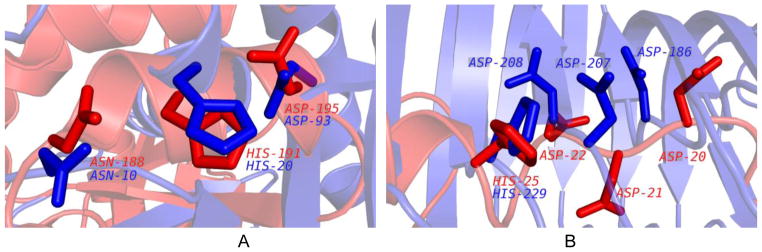
The significance of visual alignment. A. The aligned residues are shown for 1K77 (query/red; ASN188, HIS191, and ASP195) and for 2PTH (motif template/blue; ASN10, HIS20, and ASP93). The RMSD values for all non-hydrogen atoms / Cα / Cα + Cβ were 1.91 / 1.18 / 1.30 Å, respectively. B. The aligned residues shown for 1IUY (query/red; ASP20, ASP21, ASP22, and HIS25 and 1NHC (motif template/blue; ASP186, ASP207, ASP208, and HIS229). The RMSD values for all non-hydrogen atoms / Cα / Cα + Cβ were 1.93 / 1.64 / 1.56 Å, respectively.