FIGURE 3.
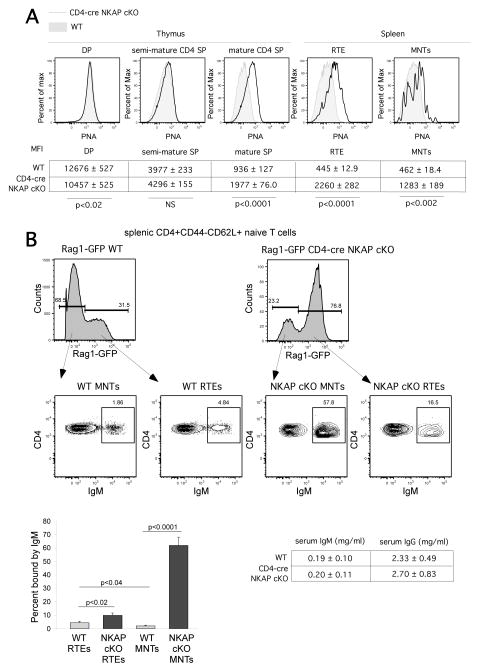
Increased binding of PNA and IgM is found on T cells of CD4-cre NKAP cKO mice.(A)Representative flow cytometry analysis of PNA binding on thymocytes and splenocytes of Rag1-GFP WT (grey filled histogram) and Rag1-GFP CD4-cre NKAP cKO mice (black open histogram) is shown. Each cell population was gated on the following markers: DP thymoctyes (CD4+CD8+), semi-mature CD4 SP thymocytes (CD4+CD8−CD24hiRag1-GFP+), mature CD4 SP thymocytes (CD4+CD8−CD24loRag1-GFP+), RTEs (splenic CD4+CD44−CD62L+Rag1-GFP+), and MNTs (splenic CD4+CD44−CD62L+Rag1-GFP−). Below the FACS plots, the average MFI with SEM for WT and CD4-cre NKAP cKO mice is shown for each population. For the thymic analysis, 8 WT and 6 CD4-cre NKAP cKO mice were analyzed. For the splenic analysis, 7 WT and 7 CD4-cre NKAP cKO mice were analyzed. Statistical analysis of the differences in MFI was performed using students t test as denoted in the figure. (B) RTEs and MNTs from Rag1-GFP WT and Rag1-GFP CD4-cre NKAP cKO mice were stained with anti-IgM antibody. Cell populations were defined as above. A representative FACS analysis is shown, and IgM binding was quantified from least 8 mice per group from 6 independent experiments. Error bars indicate SEM. Data were analyzed for significance by Student’s t test. Serum concentrations of IgM and total IgG in 8 WT and 7 CD4-cre NKAP cKO mice were determined by ELISAs. The average and SEM for each is shown. The concentrations of IgG and IgM in serum were very similar in WT and CD4-cre NKAP cKO mice.

