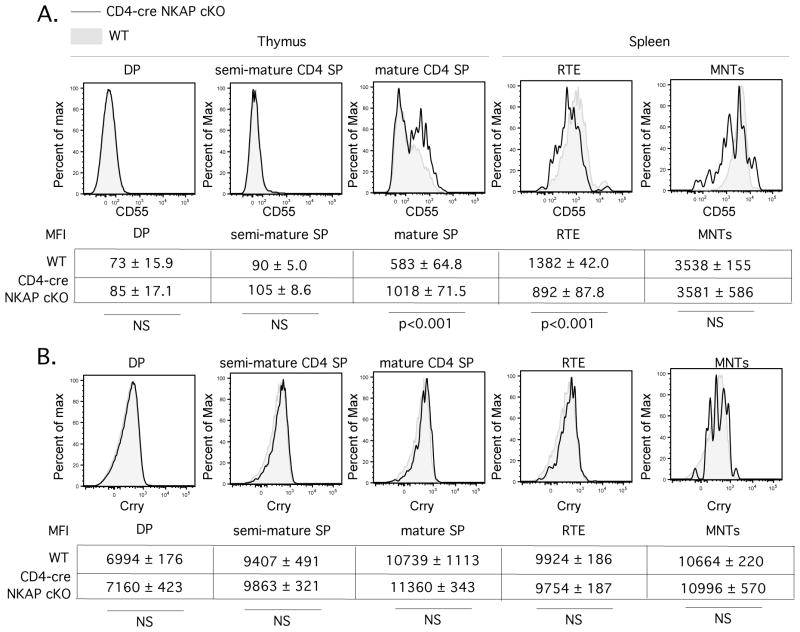
FIGURE 5.
The expression of CD55 is induced during T cell maturation, and peripheral T cells from CD4-cre NKAP cKO mice have a defect in upregulation of CD55. Representative flow cytometry analysis of CD55 (A) and Crry (B) binding on thymocytes and splenocytes of Rag1-GFP WT (grey filled histogram) and Rag1-GFP CD4-cre NKAP cKO mice (black open histogram) is shown. Populations were defined as in Fig. 1. Below the FACS plots, the average MFI with SEM for WT and CD4-cre NKAP cKO mice is shown for each population. For CD55, 7 WT and 7 CD4-cre NKAP cKO mice were analyzed for each population. For Crry, at least 3 WT and 3 CD4-cre NKAP cKO mice were analyzed for each population. Statistical analysis of the differences in MFI was performed using student’s t test as denoted in the figure.

