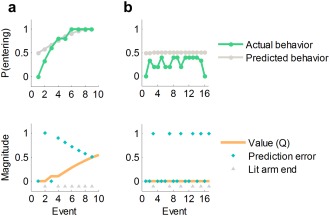
Figure 2.

Examples of behavior and model‐derived predictions for a participant who learned the task (a) and one who did not (b). The top row depicts actual and model‐predicted probability of entering a lit arm at its sighting (smoothed with a five‐point moving average). The bottom row represents the model predictions concerning values and prediction errors for the same participants (magnitude in a.u.). Participant (a) learns the value of lit arms (Q increases and PEs decrease throughout the task) and learns to enter those arms. Participant (b) shows no evidence of learning, as evidenced by constant PEs and Q and by the fact that the participant continues to enter lit arms less than 50% of the time throughout the task (note that only part of the run is shown for this participant for clarity of display). These participants were classified as learner (a) and nonlearner (b), respectively, by our classification algorithm (Materials and Methods). See Supporting Information for an example computation of Q values based on the model‐fitting procedure.
