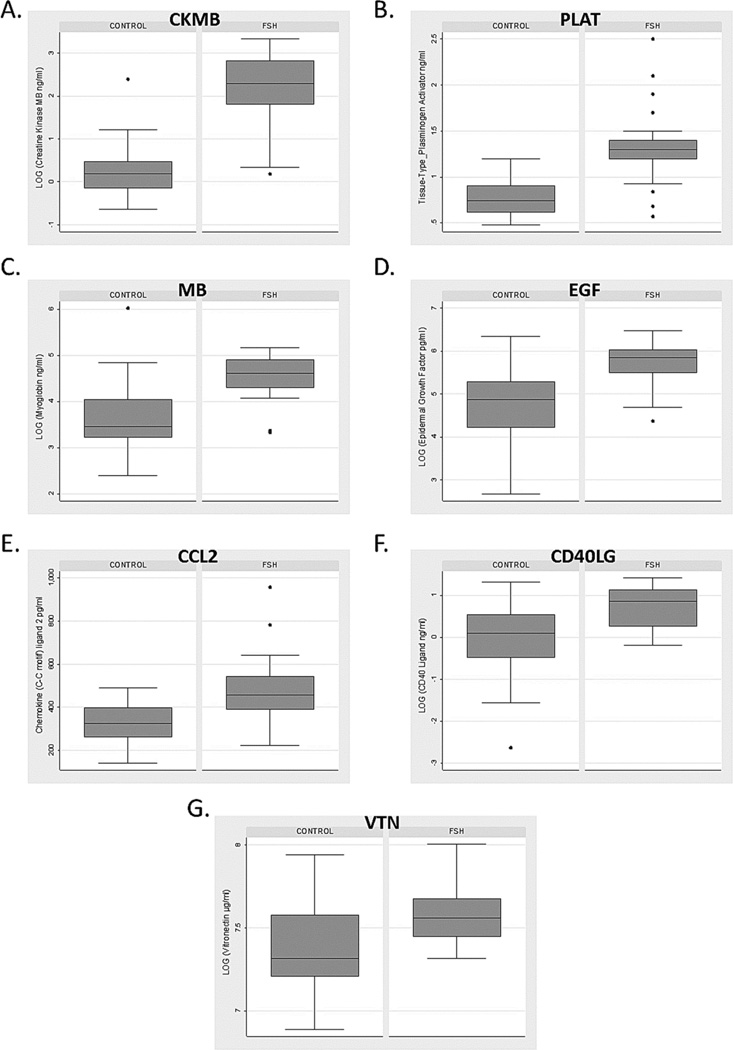
Figure 2.
Box plots of markers positive after adjustment for multiple comparisons. A) creatine kinase MB (CKMB); B) tissue-type plasminogen activator (PLAT); C) myoglobin (MB); D) epidermal growth factor (EGF); E) chemokine (C-C motif) ligand 2 (CCL2); F) CD40 ligand (CD40LG); and G) vitronectin (VN). Box and whisker plots show distribution of concentrations for each analyte. The box represents 50% of population; dark line is the median; whiskers are adjacent upper/lower values; and dots represent outliers.

