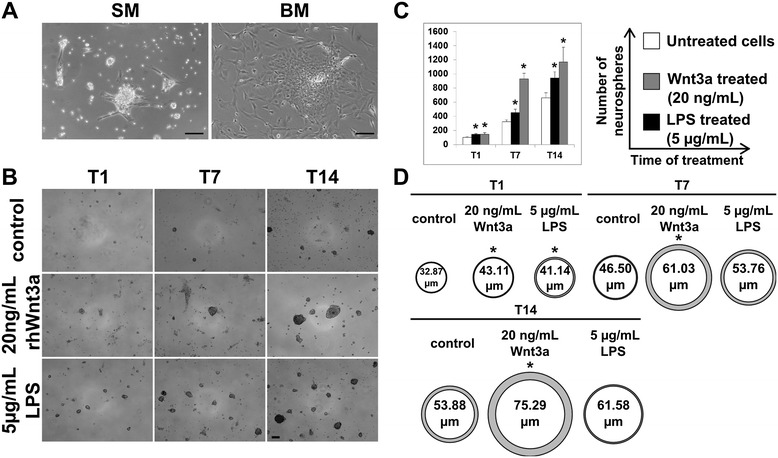
Figure 3.

ENSc and formation of neurospheres. (A) After 1 day of culture, standard medium promoted the formation of neurospheres as evidenced by optical microscopy analysis. In contrast, several fibroblastoid colonies were observed in ENS cultures maintained in BM ENS medium. Bar: 100 μm. (B) Quantitative analysis of number and diameter of neurospheres obtained by LPS (5 μg/mL) or Wnt3a (20 ng/mL) stimulation. In parallel, the analysis was performed on LPS- and Wnt3a-untreated samples that were used as control. Light microscopic pictures reflected the increased number of neurospheres treated with LPS and Wnt3a after 1 (T1), 7 (T7), and 14 (T14) days in comparison to untreated cultures (control). (C) Data were quantified and normalized to controls (100%) (n = 3). (D) Diameter of neurospheres at T1, T7, and T14 was measured (n = 150) using ImageJ software. Statistical significance compared to control; p value ≤0.05*. Bar: 100 μm.
