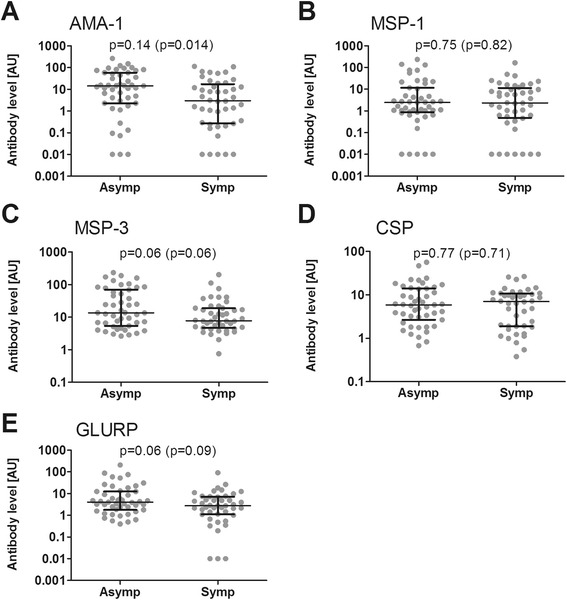
Figure 5.

Relation between antibodies at the beginning and clinical protection during the transmission season. Humoral responses at the beginning of the transmission season were assessed by ELISA against (A) AMA-1, (B) MSP-119, (C) MSP-3, (D) CSP and (E) GLURP-R0. The n = 91 children who developed parasitaemia by PCR or thick smear during follow-up were divided into two groups: a group consisting of asymptomatic children who experienced no clinical episode of malaria during the transmission season (n = 47), and a group of children who had a symptomatic malaria episode at least once during the transmission season (n = 44). Differences between the two groups were analysed by linear regression of log-transformed (log10) data, adjusting values for age. Age adjusted P values are shown for each plot, with p-values without age adjustment (Mann–Whitney U test) in brackets. Scatter plots show individual data points, horizontal lines indicate the median of the group and error bars the interquartile range (IQR).
