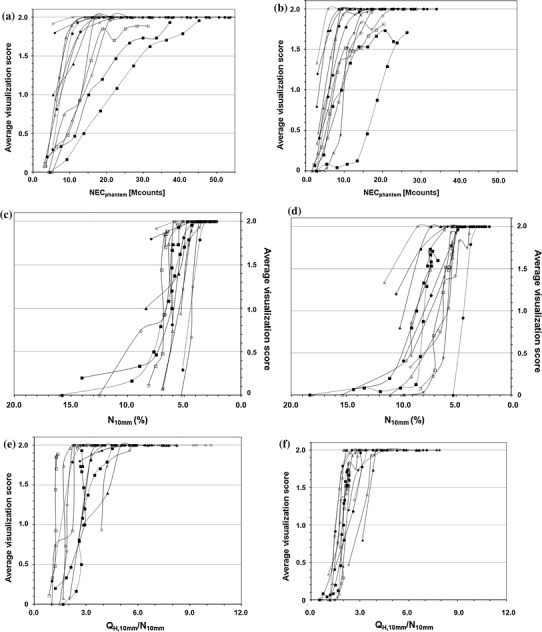
Fig. 3.

Relationship between visualization score for 10-mm sphere and NECphantom (a, b), N 10mm (c, d), and Q H,10mm/N 10mm (e, f) in Phantom experiment #1 for activity concentration of 5.30 kBq/ml (a, c, e) and 2.65 kBq/ml (b, d, f). Symbols represent camera models
