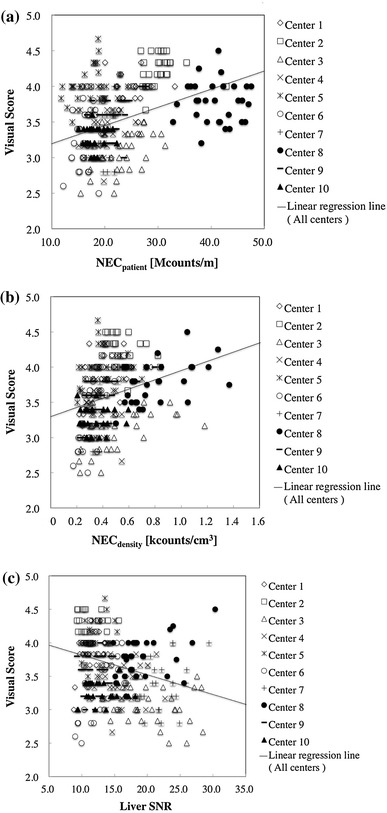
Fig. 8.

Scatter plots of visual score against NECpatient (a), NECdensity (b) and liver SNR (c) in patient scans acquired in 10 PET centers. Each plot represents a subject, and symbols represent PET centers. Linear regression line for merged data is shown for each graph
